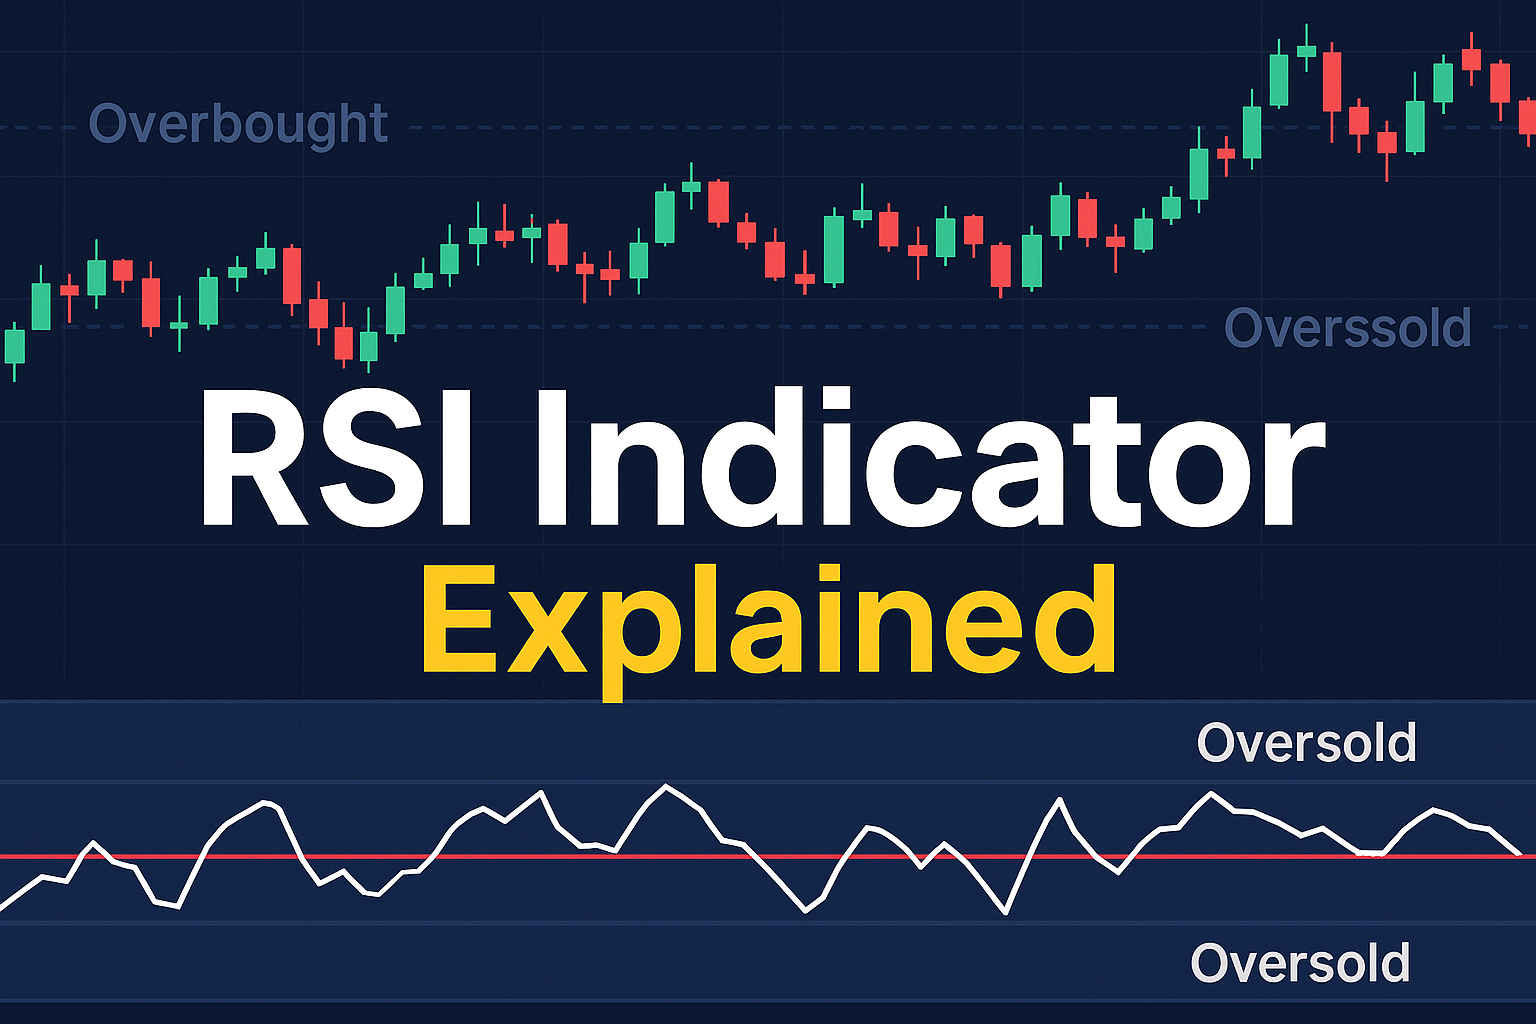
📊 RSI Indicator Explained: A Complete Beginner’s Guide
The Relative Strength Index (RSI) is one of the most popular technical indicators used by traders around the world. Whether you’re trading forex, stocks, crypto, or commodities, the RSI can help you identify overbought and oversold market conditions, potential reversals, and hidden price momentum.
In this detailed guide by HomaFinance.com, we’ll walk you through everything you need to know about the RSI indicator — from what it is and how it works, to practical trading strategies and real chart examples.
📌 What is the RSI Indicator?
The Relative Strength Index (RSI) is a momentum oscillator that measures the speed and change of price movements. It was developed by J. Welles Wilder and is usually displayed as a line graph ranging between 0 and 100.
RSI Formula:
RSI = 100 - (100 / (1 + RS))
Where RS = Average Gain / Average Loss over a specific period (usually 14 periods).
✅ Default Settings
- Period: 14
- Overbought level: 70
- Oversold level: 30
🎯 Main Uses of RSI
1. Identifying Overbought and Oversold Conditions
When the RSI value is above 70, it indicates that the asset may be overbought. Below 30, the asset may be oversold. These zones can signal potential price reversals.
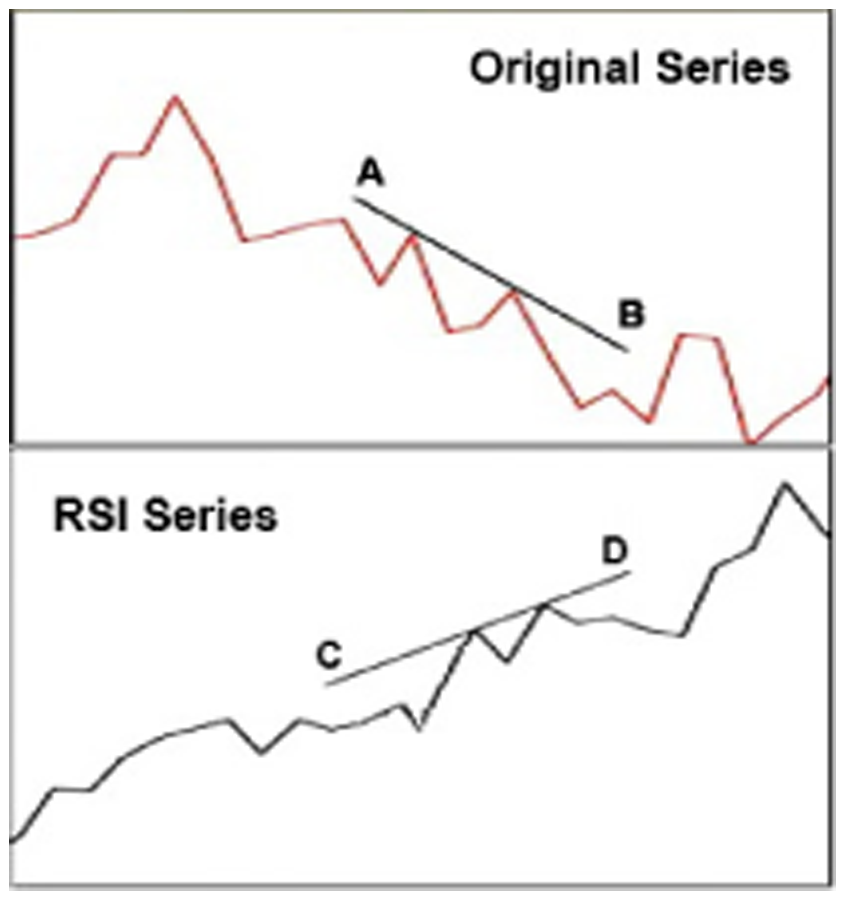
2. Spotting Divergences
A bullish divergence occurs when price makes a lower low while RSI makes a higher low — a potential reversal signal. A bearish divergence happens when price makes a higher high while RSI makes a lower high.
3. Measuring Momentum
RSI reflects momentum. A rising RSI indicates increasing strength, while a falling RSI shows weakening trend power.
📈 Best RSI Trading Strategies
✔️ Strategy #1: RSI + Price Action
Combine RSI signals with candlestick patterns or support/resistance zones for high-probability entries. For example, an oversold RSI + bullish engulfing pattern = strong buy signal.
✔️ Strategy #2: RSI and Moving Averages
Use RSI in combination with EMA 50 or EMA 200. A long trade may be triggered when RSI crosses above 30, while price is above EMA 50.
✔️ Strategy #3: RSI 50 Level as Trend Filter
The 50-level is often overlooked. RSI above 50 confirms bullish trend, and below 50 signals bearish momentum.
⚠️ Common Mistakes to Avoid
- Using RSI alone without confirmation
- Ignoring market context (e.g., RSI can stay overbought in strong uptrends)
- Overtrading every signal
🛠️ How to Add RSI on MetaTrader and TradingView
MetaTrader 4/5:
- Open your chart
- Click on “Insert” → “Indicators” → “Oscillators” → “Relative Strength Index”
- Adjust settings and click OK
TradingView:
- Open a chart on TradingView.com
- Click on “Indicators” → Search “RSI”
- Click to add. Customize values if needed
📊 Real Chart Example (RSI Divergence)
Check out this RSI divergence example in the EUR/USD 4H chart. You’ll see price forming lower lows while RSI forms higher lows — classic bullish divergence.
📘 Conclusion
The RSI is a powerful tool in any trader’s arsenal, but like all indicators, it works best when used alongside other tools and proper risk management. At HomaFinance.com, we always recommend practicing any strategy on a demo account before going live.
❓ Frequently Asked Questions (FAQ)
What is the best RSI setting?
The default RSI setting of 14 is the most commonly used. However, short-term traders might use RSI 7, and long-term investors may prefer RSI 21.
Can RSI be used for crypto?
Yes! RSI works across all markets — including cryptocurrencies — since it’s based on price action and momentum.
Is RSI reliable?
RSI is reliable when used in the right context and with confirmation from other indicators or price action.
👉 For more trading guides and strategies, visit HomaFinance.com — your trusted source for market insights.